A wrapper around hstats::hstats(). Calculates and visualizes H-statistics
for interactions in the model using bootstrapping. See help("hstats") for
details on H-statistics.
Arguments
- mrIMLobj
A list object output by
mrIMLpredicts().- num_bootstrap
The number of bootstrap samples to generate (default: 1).
- feature
The response model for which detailed interaction plots should be generated.
- top_int
The number of top interactions to display (default: 10).
Value
A list containing:
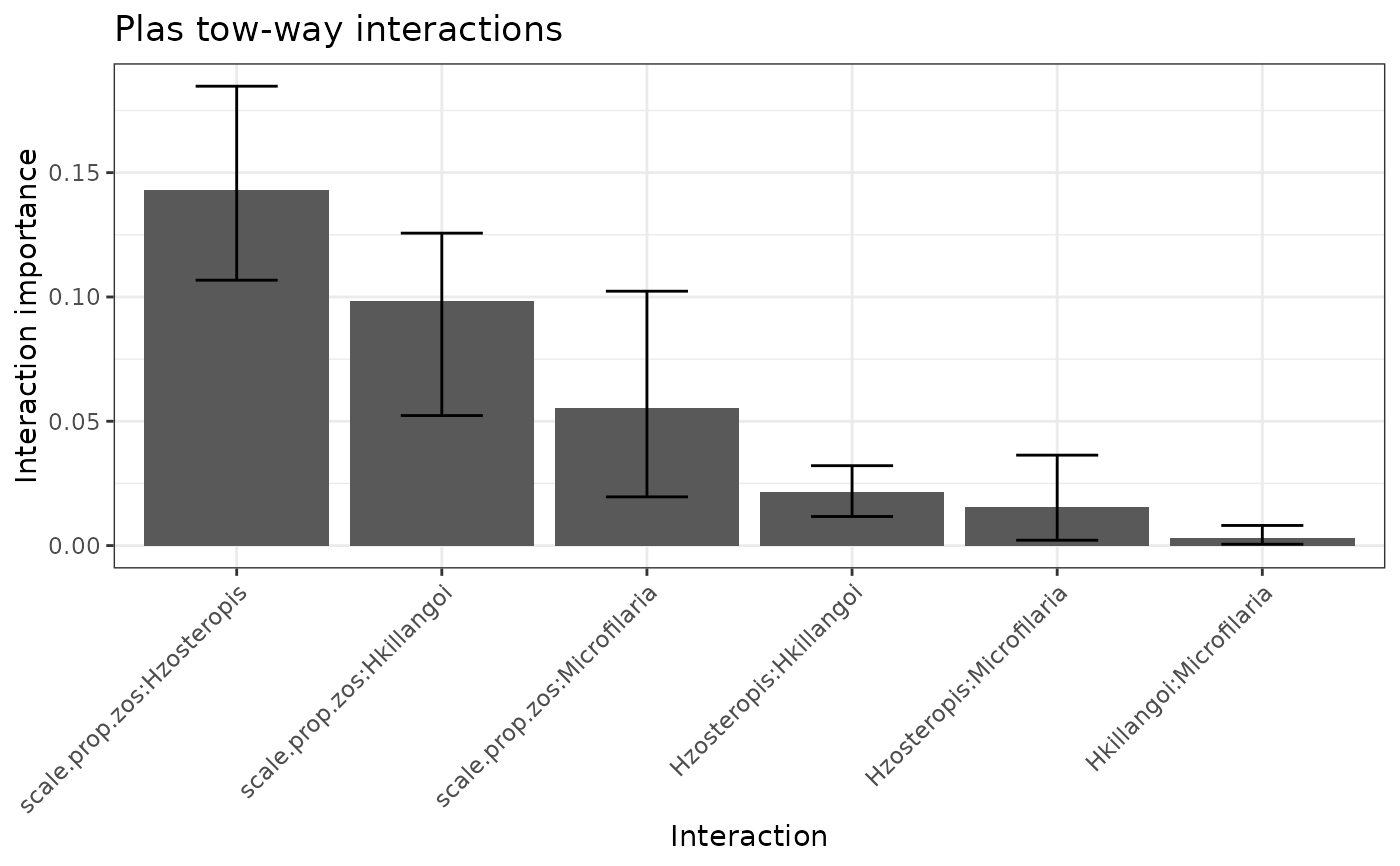
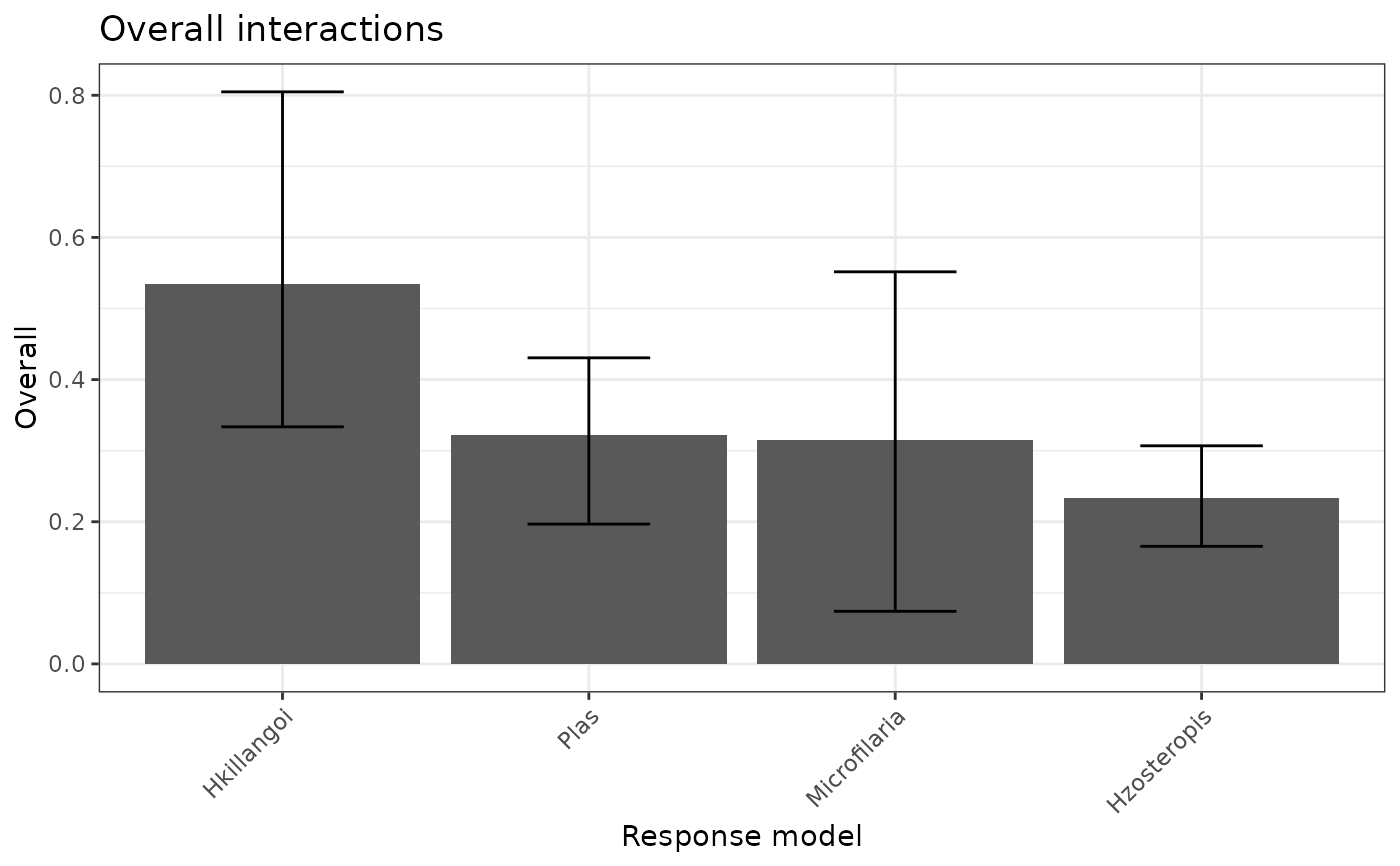
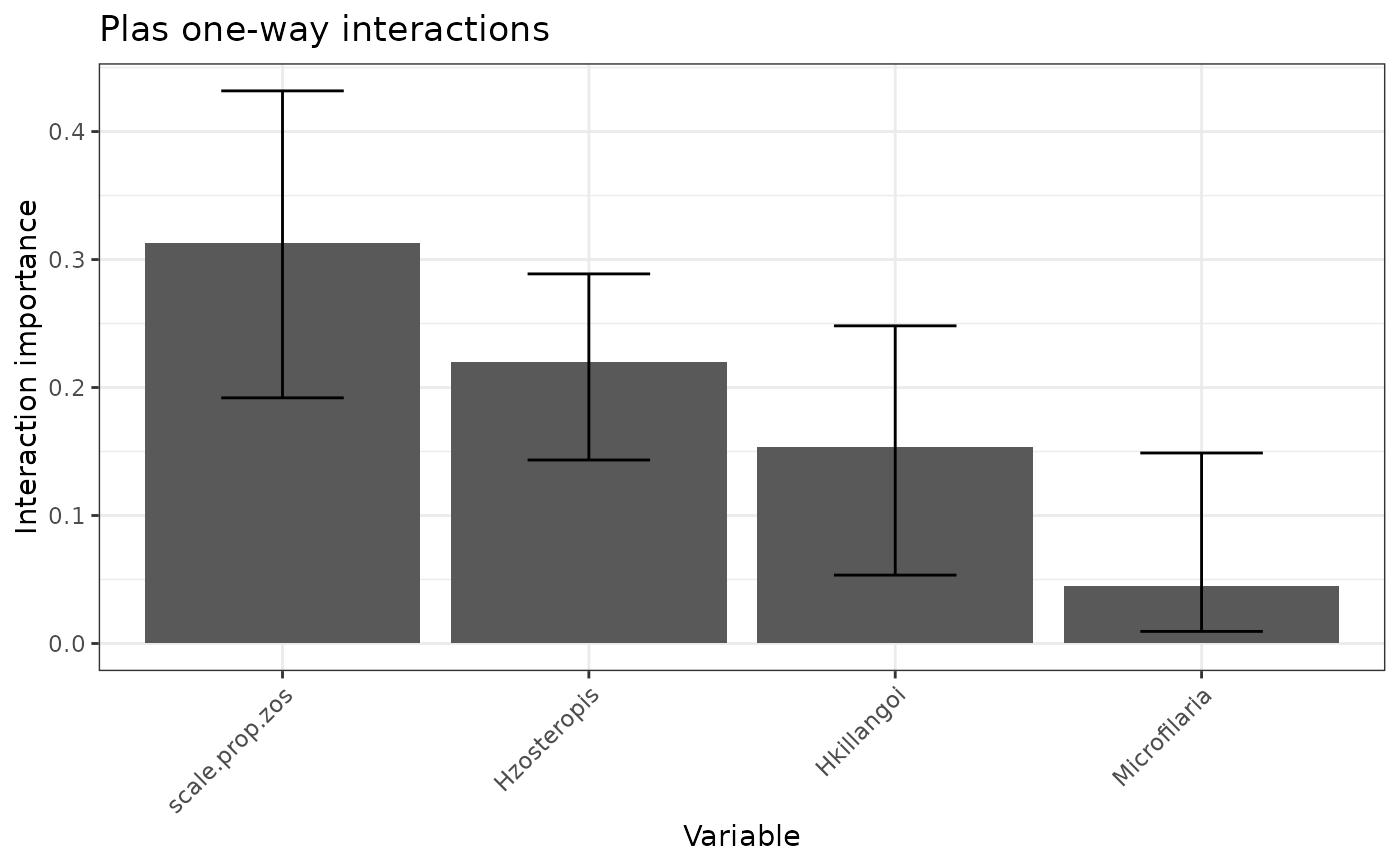
$p_h2: An ordered bar plot of the variability in each response model that is unexplained by the main effects.$p_h2_overall: An ordered bar plot of the percentage of prediction variability that can be attributed to interactions with each predictor for the model specified byfeature.$p_h2_pairwise: An ordered bar plot of the strength of the two-way interactions in the model specified byfeature. The strength of an interaction is taken to be the un-normalized square root of the H2-pairwise statistic (which is on the prediction scale).$h2_df: A data frame of the H2 statistics for each response model, along with bootstraps if applicable.$h2_overall_df: A data frame of the H2-overall statistics for the variable in each response model, along with bootstraps if applicable.$h2_pairwise_df: A data frame of the H2-pairwise statistics for the variable in each response model, along with bootstraps if applicable.
Examples
mrIML_rf <- mrIML::mrIML_bird_parasites_RF

mrIML_interactions_rf <- mrInteractions(
  mrIML_rf,
  num_bootstrap = 50,
  feature = "Plas"
)

mrIML_interactions_rf[[1]]

mrIML_interactions_rf[[2]]

mrIML_interactions_rf[[3]]