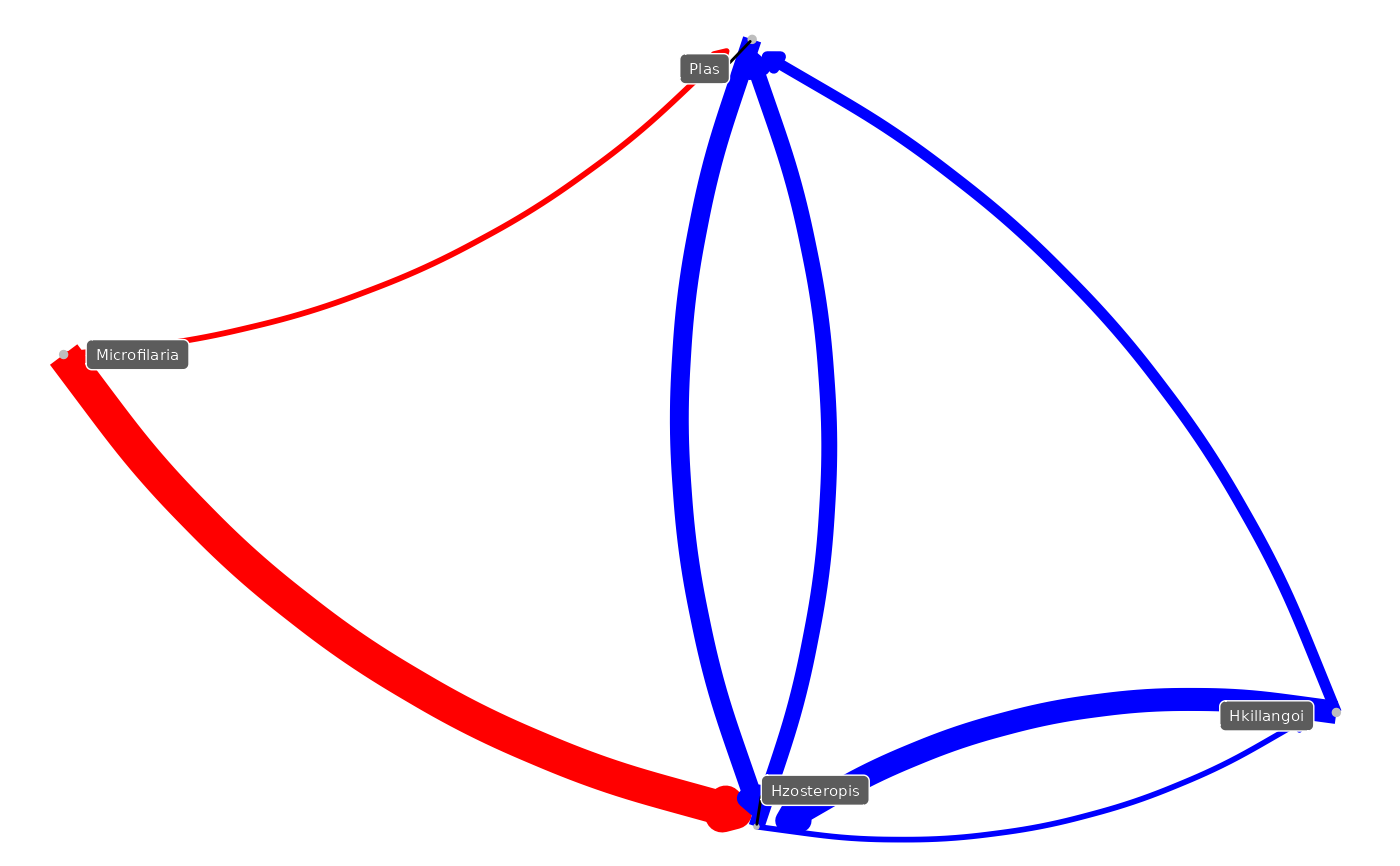
This function generates a co-occurrence network from a provided list and calculates strength and directionality of the relationships. The output can be passed to igraph to plot a directed acyclic graph (DAG).
Arguments
- mrBootstrap_obj
A list of bootstrapped partial dependencies output from
mrBootstrap().
Examples
library(tidymodels)
#> ── Attaching packages ────────────────────────────────────── tidymodels 1.5.0 ──
#> ✔ broom        1.0.13     ✔ recipes      1.3.3
#> ✔ dials        1.4.4      ✔ rsample      1.3.2
#> ✔ dplyr        1.2.1      ✔ tailor       0.1.0
#> ✔ ggplot2      4.0.3      ✔ tidyr        1.3.2
#> ✔ infer        1.1.0      ✔ tune         2.1.0
#> ✔ modeldata    1.5.1      ✔ workflows    1.3.0
#> ✔ parsnip      1.6.0      ✔ workflowsets 1.1.1
#> ✔ purrr        1.2.2      ✔ yardstick    1.4.0
#> ── Conflicts ───────────────────────────────────────── tidymodels_conflicts() ──
#> ✖ purrr::discard() masks scales::discard()
#> ✖ dplyr::filter()  masks stats::filter()
#> ✖ dplyr::lag()     masks stats::lag()
#> ✖ recipes::step()  masks stats::step()
library(igraph)
#>
#> Attaching package: ‘igraph’
#> The following object is masked from ‘package:tidyr’:
#>
#>     crossing
#> The following objects are masked from ‘package:purrr’:
#>
#>     compose, simplify
#> The following objects are masked from ‘package:dplyr’:
#>
#>     as_data_frame, groups, union
#> The following objects are masked from ‘package:dials’:
#>
#>     degree, neighbors
#> The following objects are masked from ‘package:future’:
#>
#>     %->%, %<-%
#> The following objects are masked from ‘package:stats’:
#>
#>     decompose, spectrum
#> The following object is masked from ‘package:base’:
#>
#>     union
library(ggnetwork)

mrIML_rf <- mrIML::mrIML_bird_parasites_RF

mrIML_rf_boot <- mrIML_rf %>%
  mrBootstrap()
#>
  |
  |                                                                      |   0%
  |
  |==                                                                    |   2%
  |
  |====                                                                  |   5%
  |
  |=====                                                                 |   8%
  |
  |=======                                                               |  10%
  |
  |=========                                                             |  12%
  |
  |==========                                                            |  15%
  |
  |============                                                          |  18%
  |
  |==============                                                        |  20%
  |
  |================                                                      |  22%
  |
  |==================                                                    |  25%
  |
  |===================                                                   |  28%
  |
  |=====================                                                 |  30%
  |
  |=======================                                               |  32%
  |
  |========================                                              |  35%
  |
  |==========================                                            |  38%
  |
  |============================                                          |  40%
  |
  |==============================                                        |  42%
  |
  |================================                                      |  45%
  |
  |=================================                                     |  48%
  |
  |===================================                                   |  50%
  |
  |=====================================                                 |  52%
  |
  |======================================                                |  55%
  |
  |========================================                              |  58%
  |
  |==========================================                            |  60%
  |
  |============================================                          |  62%
  |
  |==============================================                        |  65%
  |
  |===============================================                       |  68%
  |
  |=================================================                     |  70%
  |
  |===================================================                   |  72%
  |
  |====================================================                  |  75%
  |
  |======================================================                |  78%
  |
  |========================================================              |  80%
  |
  |==========================================================            |  82%
  |
  |============================================================          |  85%
  |
  |=============================================================         |  88%
  |
  |===============================================================       |  90%
  |
  |=================================================================     |  92%
  |
  |==================================================================    |  95%
  |
  |====================================================================  |  98%
  |
  |======================================================================| 100%

assoc_net_filtered <- mrIML_rf_boot %>%
  mrCoOccurNet() %>%
  filter(mean_strength > 0.05)

# Convert to igraph
g <- graph_from_data_frame(
  assoc_net_filtered,
  directed = TRUE,
  vertices = names(mrIML_rf$Data$Y)
)
E(g)$Value <- assoc_net_filtered$mean_strength
E(g)$Color <- ifelse(
  assoc_net_filtered$direction == "negative",
  "blue", "red"
)
# Convert the igraph object to a ggplot object with NMDS layout
gg <- ggnetwork(g)
# Plot the graph
ggplot(
  gg,
  aes(x = x, y = y, xend = xend, yend = yend)
) +
  geom_edges(
    aes(color = Color, linewidth = Value),
    curvature = 0.2,
    arrow = arrow(length = unit(5, "pt"), type = "closed")
  ) +
  geom_nodes(
    color = "gray",
    size = degree(g, mode = "out") / 2
  ) +
  scale_color_identity() +
  theme_void() +
  theme(legend.position = "none") +
  geom_nodelabel_repel(
    aes(label = name),
    box.padding = unit(0.5, "lines"),
    size = 2,
    segment.colour = "black",
    colour = "white",
    fill = "grey36"
  )